Examining the Most Economical Field Placement in FTTx Networks —
The deployment of FTTx continues to grow worldwide. Choosing the right design and product strategy for your network is very important, but that strategy is not the only concern. A proper engineering design deals with WHERE things go in the field — not just WHAT is being deployed. The best deployment strategy or network architecture may not achieve all the desired results if the network elements are not physically placed in an economical location. To better understand the fundamentals, a fiber-to-the-home (FTTH) system example is used for this discussion.
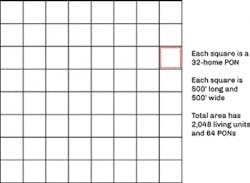
In order to determine an economical location, a basic study should develop a solution based on an ideal area: an area completely square with streets arranged in square blocks. (See Figure 1.)
Figure 1. Ideal study area.
The question is Where is the most economical location a central office (CO), node or cabinet should be placed to serve this area? The initial study consisted of moving the CO or node (the red point in Figure 2) around the area to calculate the effects of position on the total network costs. The main cost contributor is the outside plant cost as the "inside" costs (switches, terminations, etc.) remained constant. The CO or node was placed in various locations within the grid and various configurations of feeder routes were studied along with the associated support structure.
Figure 2. CO location study.
The number in each square indicates the number of sections (the added lengths of cable from the CO) required to connect each square (group of 32 homes) back to the CO. The totals indicate the number of sections required to connect each square back to the CO for that particular configuration. Note that the CO in the middle has a total of 204 sections while the other locations required more sections to connect every square to the CO. As the CO location is moved further from the middle location, the number of sections increases dramatically. Since each section has a cost for material and labor to install, placing the CO on one end of this network would more than double the outside plant costs to reach all the homes.
The representations shown in Figure 2 are just a few of the hundreds of locations studied. As the studies progressed, patterns began to emerge that are both intuitive and informative. By understanding what an ideal network should look like, an engineer can then configure a network to try to conform to the ideal as closely as possible.
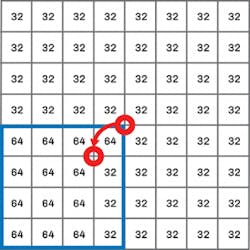
The study of CO or node location showed that the most economical location for a CO or node is in the exact middle of the area it serves. However, this assumes an area that has uniform density throughout. Of course, not all areas have this ideal characteristic. It is necessary to consider what would happen if the density was not the same. Consider the situation shown in Figure 3 where the lower left quadrant has a higher density of 64 homes instead of 32. How would this affect the ideal location for a CO or node?
Figure 3. Density effect on CO or node location.
The answer is that the denser area will have a tendency to pull the ideal location from the center of the entire serving area closer to the denser area, but not all the way to that center. The reason is that the other area costs increase as the CO or node is moved to the denser area. However, that area has more customers and will require more facilities. When blending all the costs, the denser area pulls the ideal closer to its middle, but not all the way.
Of course, the more heavily populated an area, the more the ideal location will drift towards it. So, density plays a role in CO or node location. Figure 3 indicates the effect the denser area has on CO or node location. This is a conceptual drawing that shows that the ideal location has moved closer to the densely populated area.
It is recognized that not many areas have ideal, uniform density, and the engineer must make adjustments to fit the real world. There is a very good reason to stay as close to the ideal as possible. As a location moves further away from the most central location, the total costs go up. Note that the cost rises in an exponential manner as the location moves away.
While this data was initially developed for CO or node locations, when one considers all the dynamics involved, we find that it has benefits beyond the CO or node. If an FTTH system was to be deployed with optical splitters placed in a cabinet, then the same problem arises: Where should the cabinet be placed? This is the same dynamic as a CO since the cabinet will serve a defined area, and facilities need to be connected to all customers in the area.
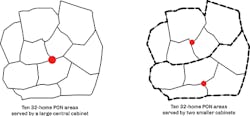
Figure 4 shows where a cabinet should be placed in an area to serve 320 homes. Note that this area was carved up into 10 areas of 32 units each called Passive Optical Network (PON) areas, as part of a basic fiber network design.
Figure 4. Cabinet locations (cabinet is red dot).
The same area is also shown with a smaller cabinet size utilized to serve 2 areas with 160 homes. As you can see, even the smaller cabinets are placed in the middle of the area. It is essential that the serving area boundary be well documented so that facilities can be planned and placed to serve a defined area and not extended past any boundary line.
In this example, smaller cabinets were placed but each one was located as close to the middle of the area it serves as possible. When this data was analyzed, it was discovered that as the cabinet location moves away from the ideal location, costs increased.
The concepts discussed can be extended deeper into the network — to any cabinet location and drop closures. The center of an area is the only location where all customers are served with the shortest route from the CO, node, cabinet, or drop closure. Any other location will increase the distance, which increases cost. Every effort should be made to get as close to the center as possible to deploy the most cost-effective network. This concept is true for any technology: copper, coax, or fiber. It is really that simple, yet profound!
Save


