
Assessing Fiber Link Loss Performance —
Networks come in many configurations, sizes, and complexities. Some are simple point-to-point links. Others employ splitters, multiplexers, and de-multiplexers. There are multi-channel DWDM networks, ROADM-based mesh networks, and now dual polarization multiplexed coherent networks. While these networks may have many differences, they all have at least one thing in common: they are all built with fiber links that operate based on managing optical link loss.
What is link loss? It is how much optical power loss accumulates over the fiber link; it’s also referred to as attenuation. As part of the network design, architects factor in a certain amount of attenuation, but the overall network link loss needs to stay below the total budget for that link.
Sources of link loss can be divided into 2 categories: 1) Budgeted (planned) contributors, and 2) Degradation (unplanned) contributors such as bending losses. This article investigates the planned contributors in a link loss budget, including the standards, range of limits for each contributor, and specific challenges. We will also discuss best practices for loss management implementation and performance assessment.
Loss Budget Contributors
Loss budget contributors are elements of loss that are a planned part of the network. They are based on optical design and construction performance limitations. Maximum limits can be found in IEC/TIA 568 standards documents. These contributors come from 3 sources:
Source #1. Fiber loss, or attenuation, is the amount of loss for each kilometer of fiber. This is calculated as decibels per kilometer (dB/km). For example: 10km of fiber at 0.2dB/km of attenuation would equal a total loss contribution of 2dB. Installed values for today’s single mode fiber at 1310nm would typically be <0.35dB/km; at 1550nm typically <0.2dB/km.
Source #2. Connector loss is the loss through a mated pair of connectors, measured in dB. Single mode connector pair losses should be <0.5dB/km and do not vary for different wavelengths.
Source #3. Fusion splice loss, also measured in dB, is the loss created by 2 fibers fusion spliced together. A splice is most often a joint between 2 reels of fiber (cable), or a joint between a terminating fiber and a pigtail (connector on one end, raw fiber on the other end). The latter is often used when transitioning from outdoor fiber to a patch panel by splicing on a pigtail. These losses can range from very low (<0.05dB per splice) up to 0.3dB per splice, the maximum allowed by the IEC/TIA 568 standards. Note: these value ranges are based on an average of the loss taken in both directions by an OTDR.
Now, let’s look at each of these loss contributors in more detail.
Fiber Loss (Attenuation)
Transmission fiber signal loss accumulates over distance. Since attenuation is an inherent part of the fiber, the goal is to install the cable without adding stress or strain to the fiber that would create additional loss beyond the natural loss specification. For purposes of this discussion, we will assume that proper placement procedures are followed and therefore this part of the loss equation stays constant.
Connector Loss
Although many advances have been made in connector design, connectors continue today to be the source of most network issues. In a study by NTT-Advanced Technology, 98% of cable installers and 80% of network owners reported connector-related contamination being the root cause of a network failure. Ironically, this loss is also the easiest to avoid by simply proactively inspecting and cleaning connectors to keep them in pristine condition.
The challenge with managing connectors is based on a common misconception that microscopic contamination is not a significant issue. Many older fiber networks are being upgraded to higher speeds, but still use the legacy connectors that were originally installed. These legacy flat polished (PC connectors) are not only badly contaminated, in many cases they are also damaged.
Our company recently re-qualified several fiber links for high-speed upgrades. The fiber was installed around 1990, and the original ST-PC connectors were still in use. The patch panels with the ST connectors were converted to LC-UPC (ultra-polished connectors) to handle the high data speeds. This replacement was necessary not only due to the higher loss of the older PC styles, but also due to the sensitivity of higher speed systems to reflections. This potential reflection problem is referred to as optical return loss, or the impact of a given connector pair as optical reflectance. Either UPC or APC (angled polished connectors) are required in networks with speeds of 10Gb/s and higher. Using UPC or APC connectors, and keeping both mating surfaces pristine through proper inspection and cleaning, provides not only 1 solution to network problems, but 2: achieving both low loss and low reflectance.
Fusion Splice Loss
While connectors are often the culprits when it comes to network loss per connection, fusion splices seem to be under a bigger "microscope" in the field. Many network operators pay the most attention to splice loss levels in an effort to achieve very low loss splices in all cases.
While achieving low loss splices is clearly important in link loss budget management, there is a debate as to what maximum limits are required to ensure both performance and practicality. There are multiple schools of thought in this debate. Three (3) representative examples are illustrated in Figure 1.
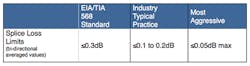
Figure 1. Examples of allowed ranges of maximum splice loss limits.
On the higher end of the spectrum, the EIA/TIA 568 standard maximum of 0.3dB is quite dated, and does not represent the technology currently available in splicing. Although a long-established standard, this limit is rarely used today in the field.
The adoption of the 0.05dB limit has become more common within some organizations. This is concerning for a variety of reasons. The first is lack of practicality. Splice loss this low may be consistently achievable under ideal conditions, such as new construction when splicing between reels of the same fiber type, age, and manufacturer, and using best-in-class core alignment fusion splicers. But in the evolving outside plant world of fiber construction, repair, and maintenance, we begin to see mixing of old and new fiber, use of different suppliers, and even mixing different fiber types — all in the same link.
With all these variations, fibers spliced together will not always mate perfectly. Let’s look at each of these scenarios in more detail.
Scenario #1. Splicing newer fibers to older fibers
Older fiber manufacturing tolerances were not as precise as they are today. This would often result in core mismatches. Figure 2 helps to visualize these variances: ovality (how round is the core/cladding), and concentricity (how centered is the core). Now imagine aligning 2 of these together if they are not perfectly round or centered. How perfectly can the cores be aligned between the 2 fibers? (See Figure 2.)
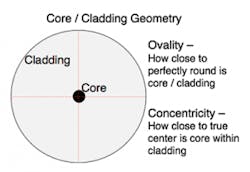
Figure 2. Core/Cladding geometry.
Scenario #2. Mixing fiber from different manufacturers
As with older fiber, the differences between manufacturers used to be greater for the same fiber type, where today they are much closer in compatibility, specifically for G.652 type fibers. However, there are variations in how fiber is formed and also how core to cladding transitions are structured. This can cause differences in geometry and in the core to cladding interfaces. These types of variations between fiber manufacturers are most common today in non-G.652 fibers.
Scenario #3. Splicing different fiber types
When fibers are spliced together that are different fiber types, there will be mismatches due to differences in core diameters and/or core to cladding transitions. Figure 3 represents the most common fiber types used in the field today. It is quite common to see any of these spliced to each other. (See Figure 3.)
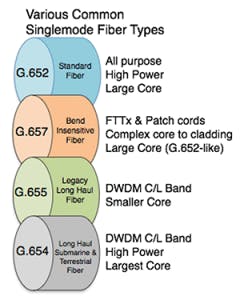
Figure 3. Common fiber types deployed today.
These differences in core diameter or core to cladding transition create differences in backscatter coefficient. In short, a fiber with a higher backscatter coefficient would sit relatively higher on the OTDR display than one with a lower coefficient. Since the OTDR is the only device that can measure splice or connector losses in the field, this relative difference can impact the reported loss value of that event if there is a mismatch.
Figure 4 is an OTDR trace showing a repair section of fiber spliced in the middle of an older G.652 fiber link. In this case, the repair section was a much newer G.652 fiber. The differences in fiber geometry, and perhaps slightly different core diameter, result in the mismatch seen here. While this example shows the comparison of old to new, this could just as easily be a difference in fiber types. In that case the offsets would be even greater.
Figure 4 also illustrates why we sometimes see an apparent splice gain (gainer) instead of a loss on an OTDR trace. The opposite effect occurs when going from a higher to a lower backscatter fiber. This is what happens when testing the same event in the opposite direction — an exaggerated loss value is measured. This phenomenon is why it is important to shoot the fiber link from both directions. The averaged value of the splice loss (or gain) bi-directionally is the only way to have an accurate reading of the loss of each event.
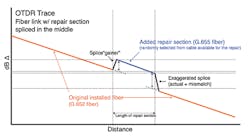
Figure 4. OTDR shows core mismatches.
It is important to note that the same gainer phenomenon for splices also applies to connector loss. Due to the higher loss values of connectors (up to 0.5dB), the gain (increase in backscatter portion) will often be hidden by the actual loss of the connector.
Implications of Aggressive Splice Loss Limits
In addition to the practicality issue explained above, another reason the .05dB limit is problematic is that it deals with how the splice loss is measured. Most splice technicians use their fusion machines to "measure" the loss during splicing. However, splicing machines are not actually loss measuring devices. These "measurements" are actually calculated estimates based on vendor-developed algorithms, and can be inconsistent in terms of reported loss values. Validation of splice loss occurs only when tested with an OTDR, which is usually later during acceptance testing or during troubleshooting and re-splicing. In instances where the OTDR reports the loss above the limit, technicians held to 0.05dB must return to the field, re-open the closure and re-splice. Many of these splices will not meet that limit even after repeated attempts, due to mismatches.
Insisting on too stringent splice loss limits can contribute to project cost overruns. This can result in higher-than-necessary labor costs and project delays from unnecessary re-splicing. A more effective approach is to look at the total loss budget target and manage each contributor at a balanced level.
Best Practices for Accurate Loss Evaluation
The OTDR is arguably the most important piece of test gear in an optical tool kit. Not only is it the only tester that can measure fiber loss segments, individual splices, and connectors; but it also provides a visual view of the link for documentation and analysis. In earlier days, the OTDR was used during the splicing process to monitor splice performance in real time. Reductions in labor costs and the improvement in fusion splicers over the years have largely eliminated this monitoring step. So now the OTDR test is not normally performed until the fiber splicing has been completed.
The OTDR is the critical tool for identifying fiber mismatches and measuring the loss of those splices accurately. The only way to accurately assess these joints is to test in both directions and average the bi-directional results. As a best practice, we recommend performing averaged bi-directional OTDR testing to achieve the most accurate results. (See Figure 5.)
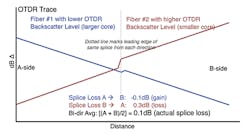
Figure 5. OTDR averaged bi-directional splice loss measurement.
Setting the splice loss limit in the range from 0.1 to 0.2dB is a practical approach that is more widely used in the industry today. While low losses in the 0.05dB range will be frequently achieved, a slightly more relaxed maximum limit will allow for core mismatches and still pass good splices when measured bi-directionally and averaged.
Comparing Link Loss Calculations
We have looked at the contributors to loss and the different approaches to setting splice loss limits. Now we will compare the total calculated loss when combining the 3 loss contributors (fiber, connectors, and splices) based on the use of 0.05dB versus 0.15dB splice loss limit. Each loss contributor is then counted in the link loss table to determine their collective impact.
Figure 6 illustrates network diagrams of each link, along with a table showing the total loss calculations using different splice loss limit assumptions. To compare effects in different length situations, 2 link examples are shown: 1) a relatively short link of 30km with 5km span sections, and 2) a longer link of 80km w/5km span sections and 1 mid-point patch-through.
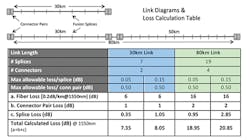
Figure 6. Link loss diagrams and table. Comparison of splice loss assumptions on different link lengths.
Based on the table results in Figure 6, we can make several key observations:
• In both link examples, the largest contributor to the link loss total is the fiber itself.
• The individual impact of a single connector pair loss at 0.5dB is much higher than a single splice. Therefore, the need to keep connector losses low is paramount (inspect and clean).
• Splice loss limits can be set moderately (0.15dB example) with minimal additional impact on overall link loss.
Link Loss Lowdown
It is important to fully understand link loss requirements and components in order to effectively manage loss. Since connectors are the most frequent source of network failure, ensuring connector end face cleanliness is critical.
• ALWAYS inspect and clean all fiber end faces: patch cords, bulkheads, and test output ports.
• Set reasonable limits for fusion splices to ensure a healthy link within loss limits, while also allowing for splice loss variances when fiber mismatches are present.
• Using the OTDR, splice losses should be measured in both directions and the values averaged for accurate results.
Today’s networks are comprised of many different configurations, sizes, and complexities. The fiber infrastructure is the foundation of any network. The physical infrastructure must be fundamentally capable of supporting the data, speeds, and wavelengths that will be carried over it. And building a solid foundation starts with solid link loss management.
About the Authors:
Tim Yount, CFCE, CONA, is Co-Founder and VP of Training & Consulting for Fiber Insight, LLC. They provide fiber technology education test training, as well as custom test consulting. Tim specializes in characterizing and troubleshooting a wide range of fiber networks, from access and enterprise to metro and long-haul, high-speed applications. For more information, please call 207.329.3342, email [email protected], or visit www.fiberinsight.com. Tim’s Twitter handle is @FiberInsight.
Carla Yount is Co-Founder & President; VP Operations, Finance; Grant Writer & Editor. They are also proud to be a woman-owned company. Carla leads operations, logistics and also brings technical writing, editing, and software training development expertise to the custom services side. She holds a masters in software engineering, and has worked in the IT industry for over 20 years. Her background includes DoD work with BAE Systems & Lockheed Martin, energy sector with Duke Energy, and more than 10 years in university R&D. For more information, please call 207.329.3342, email [email protected], or visit www.fiberinsight.com.
About the Author