Part 3 of 4: Proper Test Setup and Configuration —
Welcome to Part 3 of a 4-part series on getting the most out of your OTDR. In Part 1 (ISE magazine, June 2019, "Are You Getting the Most Out of Yours?") [https://isemag.com/2019/06/fiber-optic-otdr-tips-techniques], we summarized the capabilities of the OTDR and discussed recent enhancements. In Part 2 (ISE magazine, July 2019, "3 Key Questions You Must Answer About Link Connectivity") [https://isemag.com/2019/07/fiber-optic-otdr-tips-techniques-2], we explored connectivity and how important it was to obtain valid and accurate test results, and we provided some guidelines about best practices.
In this 3rd installment on the OTDR, we discuss the importance of proper instrument setup, how it impacts your test results quality, and the resulting data.
Better Configuration for Your Testing Scenario = Better Results
As noted in earlier articles, the OTDR is a powerful testing tool, especially when used by a properly trained technician. A critical part of getting the most from this valuable tool is a direct result of properly setting up and configuring the OTDR for each specific test situation.
The majority of OTDR test technicians either work for large communications service providers or test contractors. Our company specializes in advanced infrastructure testing and provides fiber characterization certification training or CFCE (http://www.fiberinsight.com/cfce.html). When I cover best practices for ensuring proper test setups and consistent inspection and cleaning, I often get pushback from technicians about the time required for this type of preparation. The reality today is that many technicians are under significant pressure from management to focus on completing the job quickly, often leading to tests being performed without best practices being followed.
But there is a reason the concepts discussed in this article series are considered best practices — and skipping them can compromise the very advantages offered by using the comprehensive multi-tool OTDRs available on the market today. My response to that pushback is simple: Spending the time and financial resources to utilize an OTDR and then not following proper procedures is a waste of critical time and money. What is the point of expending the budget and effort to obtain the tool if you do not intend to use it properly?
We begin this discussion by looking back to the visibility scenario introduced in Part 1 of this series (June 2019 issue):
Example: Mid-Span — Multiple Closely Spaced Events
A technician shooting between 2 data centers submits traces showing links that appear fine at the time, but engineers reviewing the trace data later see the mid-span (where trouble is suspected) with 1 wide reflection and >1dB loss. Engineers are aware of a patch through with about 150m of fiber in-between patches, but they are unable to view the 2 patch interfaces individually.
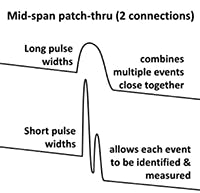
In this example, illustrated in Figure 1, the trace might appear normal at first look or to the untrained eye. But to a skilled OTDR user, and based on the trace view and OTDR settings, a shorter pulse width could potentially separate and measure each of the mid-span panels.
Figure 1. Mid Span Resolution
This problem could have been avoided if proper OTDR settings had been pre-configured to allow for the visibility needed in this scenario.
In this article, we discuss how to prevent these situations by using OTDR settings to get the most accurate test results, even as situations change. We also look at ways its efficiency can be improved, allowing settings to be loaded faster and more consistently while still meeting company time limitations.
InvisiLight® Solution for Deploying Fiber
April 2, 2022Go to Market Faster. Speed up Network Deployment
April 2, 2022Episode 10: Fiber Optic Closure Specs Explained…
April 1, 2022Food for Thought from Our 2022 ICT Visionaries
April 1, 2022Understanding OTDR Settings
The OTDR is a complex device with a myriad of settings which can seem overwhelming at first look. It helps to break the settings down into categories; we’ll discuss each category.
Category 1. Initial Pre-Test Setup Shot
Category 2. Test Acquisition Settings
Category 3. Launch and Receive Fiber Lengths
Category 4. Display and Analysis Settings
Category 5. File Naming and Storage
Category 1. Initial Pre-Test Setup Shot
Before testing begins, you should first take an initial view of the span to see what you have and fundamentally how the OTDR is behaving with that span. We will assume proper inspection and cleaning procedures have already been followed prior to setting up the OTDR configuration (https://isemag.com/2019/07/fiber-optic-otdr-tips-techniques-2). To take a simple auto-shot, select the wavelengths you plan to test and then select AUTO-TEST. This can help determine optimum settings based on overall conditions (link length, end-to-end loss, effective OTDR dynamic range).
The information gathered from this initial shot can first be used to set acquisition parameters (these settings are tied to the acquisitions and cannot be changed on the trace after the shot is made). The following acquisition list does not necessarily include all possible settings, but it covers the most important ones.
Category 2. Test Acquisition Settings
These settings impact the actual OTDR test itself. If these are not optimized and result in a poor trace, the fiber must be retested. Here are the settings and key guidelines related to each one:
Test Wavelengths (single mode)
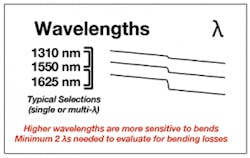
• At least 2 (1310/1550 or 1550/1625) to locate bending related losses.
• Which wavelengths depend on link length and the operating range (e.g. C-Band DWDM).
• While the primary wavelength would be in the wavelength range of operation, the second wavelength should be above the operating range to help identify bending related losses. (See Figure 2.)
Figure 2.
Distance Display Range
• We recommend about 2 times the link length to avoid pulse rep rate related ghosting.
• Avoid using a long (more than three times the link length) display range, as it affects display resolution.
Pulse Width
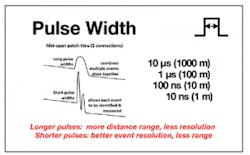
• Select the shortest pulse width enabling a test to the far end with a clear trace.
• While you can see farther with longer pulse widths, shorter pulses allow you to resolve (see separately) events located close together, as in the scenario noted above.
• The pulse width in nm can also be measured in meters. Example: 100ns = 10 meters of distance displayed on the OTDR; 50ns = 5m.
Figure 3.
In Figure 3 you can see that the longer pulse hides 2 events close together. When shot with a shorter pulse, events close together may be resolvable.
Averaging
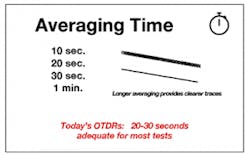
• With today’s OTDRs, averaging for 20-30 seconds is almost always adequate. If only testing a few strands, I usually average for 30 seconds. If testing many fibers over multiple spans at multiple wavelengths, I will average for 20 seconds. This still results in good traces and saves 10 seconds per wavelength. While a 10-
second decrease may not sound like much impact, testing 3 wavelengths bi-directionally will result in over 60 seconds of test time per fiber. If testing 25 fibers over multiple spans, you can see how the overall time added becomes notable. (See Figure 4.)
Figure 4.
Resolution
• This setting can be left on the default of AUTO, unless performing a specialized test to optimize resolution or range. (See Figure 5.)
Figure 5.
Category 3. Launch and Receive Fiber Lengths
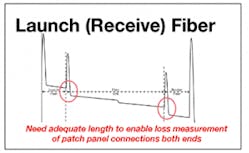
Having a section of fiber between the OTDR and the fiber under test allows you to assess the loss and reflectance of the patch panel connection. While the best length to use is hotly debated and depends on what you are testing, we will focus our discussion today on the setting.
The purpose of the setting is to isolate your test access fiber from the link under test. For example, for a 500-meter launch fiber, declaring 500m as the launch fiber end will start measuring distance from the patch panel. Also, the measurements will not include your launch fiber.
The 2 most common setting options are:
Set for event one from start and end (or 2 or 3). A possible problem is if the OTDR does not identify all events consistently, the marked location for the launch and receive fibers can be incorrect or can be different from fiber to fiber.
Measure the length of the launch and receive fibers and enter that value exactly. This is recommended to ensure trace consistency and accuracy. (See Figure 5.)
Category 4. Display and Analysis Settings
Index of Refraction (IOR)
It is critical this setting be as accurate as reasonably possible since it correlates the OTDR to distance. However, keep in mind that in most cable designs there is more fiber than sheath length (over-length factor). These vary with cable configurations, manufacturers, cable diameters, etc. While basic values should be close, this setting is only as effective as the network documentation is accurate. Most often there is more variability in as-build documentation and slack locations.
The most accurate way to ensure good IOR for a project is to test the cable on the reel — determine the physical length from the sheath markings plus noting the length of any access cords. Test the reel and set a marker on the end spike, noting the distance. Adjust the OTDR IOR setting until the displayed length matches the physical length.
Units of Measure
This should be set based simply on preference or company practices.
• Select preferred displayed units from meters, km, miles, feet. Note there is also a choice of kilofeet.
Pass/Fail Threshold Alarms
If you are asked to grade test results on a pass/fail basis, setting alarm limits for specific tests as required makes sense. It also helps to alert the test engineer as the test data is monitored if it is exceeding limits, in case decisions need to be made before continuing.*
*Note that when using post-processing reporting software, it is possible to set up pass/fail criteria and apply it during post-analysis and final documentation. In that event it is not necessary to also set up pass/fail values during the testing process.
Category 5. File Naming and Storage
It is critical to correctly and clearly label files and store them logically and consistently. Effective file-naming practices and a solid data storage process go hand in hand. Following this simple procedure before each span is tested eliminates the panic sometimes experienced after technicians return to the hotel after a long day of testing and cannot locate the files. Imagine how that panic might be magnified if this problem is not located until after returning to home base after working in a remote location.
Some storage decisions to be made ahead of time include:
• Determine if storing data on OTDR hard disk or USB stick, or on the cloud.
• Creating a directory for the test project and subdirectories for each span is recommended. This keeps data organized and easy to access and identify later.
• Verify that saved data is going to the desired location. I use the Auto-save function and Auto-increment when testing consecutive fibers on a span.
• Having clear and descriptive naming conventions is important. Be consistent but avoid including information that is redundant or unnecessary. Filenames that are too long or confusing create unnecessary issues.
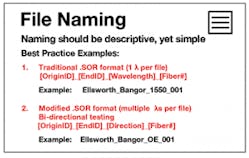
We recommend the following for bi-directional OTDR testing: OriginID_EndID_Direction_Wavelength (if storing one file per wavelength) _Fiber(port)Number
Use common .SOR type file formats. All OTDRs offer this common format. It allows any vendor to be able to
view and print other vendors’ traces. (See Figure 6.)
Figure 6.
As a best practice, we recommend checking after the first fiber is tested on a span to make sure it is being saved in the correct location with the proper naming standard. Then after completing the span, count all the files to make sure none are missing. These steps minimize the need to return to the test location to retest due to a storage or other software glitch.
Match Setups Between Testers for Bi-Directional Testing
To enable bi-directional "butterfly" trace analysis, both A and B-side test units need to be set up the same way — except one is named Origin (or A-side) and the other one is named End (or B-side). They also need to assign which is A>B and which is B>A.
For launch and receive fibers, remember: A-side’s launch is B-side’s receive, and vice-a-versa.
NOTE: These guidelines do not reflect all possible setups; we are including only the most important.
Using Pre-Defined Configurations
The ability to choose the best setting for dynamic test scenarios as described above comes only with proper training and some experience. But what about new technicians?
To make the process easier and create more consistency between technicians and teams, the use of pre-defined configuration (config) settings are becoming more commonplace. These setups are prepared by a more experienced user based on a range of test conditions that are most common for a given group or company. Once the settings are created in the OTDR, they are named and stored as configuration files — either on the OTDR itself, USB sticks, or, more commonly today, in the cloud where updates can be rolled out easier to a larger group of technicians.
Technicians are directed to use certain configuration setting files that relate to certain characteristics of the link they are to test. Instead of the technician having to take the time to set up the unit, they simply load the appropriate config file and go.
Using these pre-defined setting configurations not only helps ensure OTDRs are set correctly, but that different teams testing in different areas are providing consistent settings between test groups. It also speeds up testing efficiencies.
Typically, experienced test engineers categorize a range of setups based on span length, typical loss in system, and naming conventions. There are often some tweaks required, but instructions can include those specifics, such as Location A, Location B, and fiber (or port number).
Like this Article?
Subscribe to ISE magazine and start receiving your FREE monthly copy today!
Coming Up Next in the Final Installment
In the next and final installment of this 4-part series we look at file management and post processing (trace analysis and result reporting). No matter how good the connectivity and accurate the settings, these are of little value unless staff is properly trained to analyze the resulting traces and produce the reports needed to communicate that information to management. The final article covers these aspects of this critical last step to close the fiber characterization testing loop.
