Fault Isolation Using OTDR Technology Enables Advanced Fiber Optic Network Assurance —
Network operators around the world are experiencing tremendous growth and demand for high-speed network connectivity and services. The proliferation of 5G networks, connectivity at the edge, expanding data centers, and Fiber-to-the-Home (FTTH), are some of the factors driving that growth.
While much talk has been around 5G and increased wireless speeds, fiber optic cables are at the heart of every network feeding bandwidth and enabling these new technologies and services. In turn, the need to qualify the network for these new services has spurred one of the fastest-growing segments of the testing market, the Optical Time Domain Reflectometer (OTDR).
OTDR allows network operators to qualify and troubleshoot their fiber networks to ensure highest-level Quality of Service (QoS). Fault detection and isolation are critical in every stage of the fiber optic network life cycle, from deployment and certification to maintenance and ongoing diagnostics and monitoring.
With many years in fiber cable placement, splicing and testing for a Tier 1 service provider, this topic is near to my heart. When I became an Operations technician, turning up and maintaining DS1 to 10G systems, I knew there were better ways to measure fiber assurance. Therefore, I want to help you make OTDR technology work for you and your network.
The Tried-and-True
OTDRs have been around for some time. While the technology has improved over the years, to a large degree the science behind them is mostly unchanged. An OTDR sends out pulses of light at a specific pulse width and interprets the returned backscatter. The reduction in backscatter power is compared to the round-trip time to determine the location and performance of the event. A detailed analysis of the network is performed measuring span loss, optical return loss (ORL), and a full breakdown of component losses along the link, including fiber section attenuation, splice losses, connector loss, and reflection. There is a level of expertise involved, and often multiple shots at different pulse width are needed to better identify issues.
The "Chronics"
Those who have experienced a copper-based telecom world understand noise mitigation and the need to clear chronic issues. When it comes to fiber optics, the biggest contributor to "chronics" are connectors. Wherever there is a change of material type, such as a connector where the signal goes from fiber to air and back to fiber, there will likely be some reflection back towards the transmitter, which is undesirable, creating additional attenuation. Reflection contributes to the optical signal to noise (OSNR) ratio, which is one of the principal characteristics to determine the performance of a fiber and which has a direct relationship with Bit Error Rate (BER).
Connectors are known culprits that can have high failure rates if not tested properly prior to installation or if not properly maintained. In fact, research has shown that 80% of network owners report having issues linked to bad connectors, which can negatively impact network performance as a whole. NTT-Advanced Technology Research cites contaminated connectors as the Number One cause of network failure.
InvisiLight® Solution for Deploying Fiber
April 2, 2022Go to Market Faster. Speed up Network Deployment
April 2, 2022Episode 10: Fiber Optic Closure Specs Explained…
April 1, 2022Food for Thought from Our 2022 ICT Visionaries
April 1, 2022When I was an operations technician my primary tool for troubleshooting was a simple power meter. If we were taking BIT errors on a system, I used that power meter to measure my power level. If the power level was within the receiver sensitivity, I started to inspect and clean connectors. (I am not cleaning connectors to improve power but to improve reflection. A power meter measures power and not reflection.) With multiple tie cables, patches, and hand-offs, it is not uncommon to see 5-10 connections in a facility before the fiber hits the OSP. Isolating the faulty connector can be challenging. If set up properly, OTDR tells you which connector in your facility is contributing the most reflection.
The Art of Detection
When it comes to precise fault isolation, it is not just about knowing where the problem is located; it’s also understanding where the problem is not located. Incorrect setup can lead to merged or hidden events, which can lead to misidentifying where the problem lies.
3 CRITICAL PARAMETERS in OTDR setup are Range, Pulse Width, and Duration. You need to adjust these settings to optimize event detection.
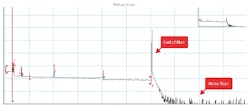
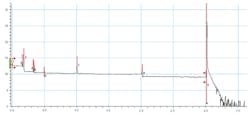
1. RANGE sets the distance the OTDR will measure. If you are doing a full span shot, you want to see the end of fiber and the noise floor. Ideally, I like to see the trace graph fill up 50-75% of the range. (See Figure 1.)
Figure 1. Typical OTDR trace showing the end of fiber vs. the noise floor.
2. PULSE WIDTH sets the length of the pulse based in time. The longer the Pulse Width, the more energy and further you can test but at the expense of spatial resolution or how closely 2 events can be for detection. If I can see a splice at 60 miles, the Pulse Width required for that does not allow me to see an event at 60 feet.
3. DURATION sets the amount of time per wavelength that the OTDR software will average out the noise. Increasing the test time improves the Signal to noise ratio, allowing the trace to clean up noise better at a shorter Pulse Width (PW).
PW and Duration work hand in hand. As I decrease my pulse width, I can detect closely spaced events but cannot test as far. I will need to increase my averaging time to compensate for additional noise clean-up.
Figure 2. This is a trace at 5ns PW and a 5-second duration. You can see the additional noise which could lead to false and hidden events.
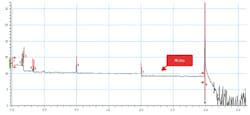
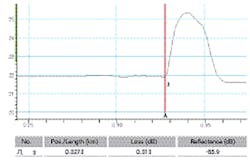
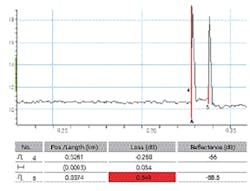
Figure 3 illustrates when the duration is increased to 45 seconds; the noise improves significantly. If I were to increase my PW, I could reduce my Durations back down to 5 seconds, but I sacrifice spatial resolution. The event shown in Figure 4 and Figure 5 is actually 2 connectors.
Figure 4. At 100 ns PW and 5-second Duration zoomed into this event, we see only 1 connection.
Figure 5. At 5ns PW and 45-second Duration, we can clearly see and measure 2 connectors.
Put simply, I want to use the shortest PW in a reasonable amount of time. If I am testing high count cable, 864+ duration becomes more of a concern. At 60 seconds for 2 wavelengths, an 864 could translate into 40+ hours to test. I also do not want to sacrifice the quality of my results.
In a maintenance situation, the challenge is ensuring that we are seeing and separating all the events. A backhoe sticking up out of the fiber is not difficult to identify, but closely spaced events and precise fault isolation are challenges. In this situation, I would increase my duration which allows me to use a shorter PW. I would rather test 60 seconds or more per wavelength than send a technician to the wrong patch panel or splice increasing my Mean Time to Recovery (MTTR).
With the information provided, we can put the pieces together and make more informed decisions.
OTDR Innovation Continues
Advancements in OTDR technology have helped automate the process and can equip any technician, regardless of experience level, with the tools and information necessary to expertly troubleshoot an optical network.
It is easy to see how misconfigured OTDRs can lead to increased MTTR and reduced QoS. Knowing how to set up an OTDR properly does require some expertise.
OTDR test equipment manufacturers are striving to provide greater accuracy, functionality, and efficient data collection, to support growth in fiber optic networks with powerful and insightful test solutions.
One option in the market is an Intelligent Optical Link Mapper (iOLM) that maximizes the OTDR’s intelligence and automation. EXFO’s iOLM is an innovative OTDR-based application that uses multi-pulse acquisitions and advanced algorithms to deliver information on every element in the link.
It does this by shooting multiple acquisitions at multiple pulse widths and returning comprehensive results with actionable steps. No setting up Distance, Pulse Width, or Duration, anymore. You can always see an event at 60 feet and 60 miles without sacrificing the quality of the trace.
With the push of a button, any technician can instantly become a fiber testing expert.
Whether using an OTDR or newer advanced technologies like iOLM, it is important to understand the basic fundamentals of fiber optics as well as OTDR theory. The investment in education and training to better understand this pays off with improved Quality of Service and reduced MTTR.
For more information, email [email protected], and visit https://www.exfo.com/en/products/field-network-testing/otdr-iolm/iolm/. You can also follow Kevin on Twitter @Yokwe, and follow EXFO on Twitter @EXFO.
