Cyberstates 2019™ Report
Technology Employment Expands Its Presence in National, State, and Metropolitan Workforces —
CompTIA presents its 19th annual edition of Cyberstates. CompTIA designed this report to serve as a reference tool, making national, state, and metropolitan area-level data accessible to a wide range of users
"The findings attest to a tech labor market that will remain tight as employers balance short-term needs with an eye towards the future," said Tim Herbert, Senior VP for Research and Market Intelligence at CompTIA. "As digital-human models begin to unfold, employers and employees alike will face new challenges — and opportunities, in shaping the workforce of tomorrow."
DEFINING NET TECH EMPLOYMENT
The tech workforce consists of 2 primary components, represented as a single figure by the "net tech employment" designation. The foundation is the set of technology professionals working in technical positions, such as IT support, network engineering, software development and related roles. Many of these professionals work for technology companies (46%), but many others are employed by organizations across every industry sector in the U.S. economy (54%).
The second component consists of the business professionals employed by technology companies. These professionals — encompassing sales, marketing, finance, HR, operations and management, play an important role in supporting the development and delivery of the technology products and services used throughout the economy. 34% of the net tech employment total consists of tech industry business professionals.
One final segment involves workers classified as self-employed. For the purposes of this report, only dedicated, full-time self-employed technology workers are counted towards net tech employment. Workers that are characterized as "gig" workers, which may entail working on the side for supplementary income, are excluded from this analysis due to a number of uncertainties with the data and to minimize the possibility of double counting.
InvisiLight® Solution for Deploying Fiber
April 2, 2022Go to Market Faster. Speed up Network Deployment
April 2, 2022Episode 10: Fiber Optic Closure Specs Explained…
April 1, 2022Food for Thought from Our 2022 ICT Visionaries
April 1, 2022REPORT HIGHLIGHTS
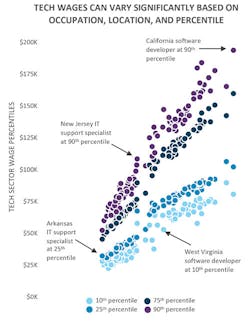
• There are many nuances to the tech wage discussion. At the industry level — meaning the universe of technology companies in the sector, wages encompass all staff positions, from the CEO down to entry-level helpdesk workers. Both technical and nontechnical positions factor into the industry wage calculation. Because of the diversity of positions covered, interpreting summary industry wage data can be problematic.
• In comparison, tech occupation wages cover only technical positions. This is the primary focus of the wage data of this report.
• The scatterplot graph illustrates the degree to which wages will differ across states. For example, the data in this graph presents wages for software developers and IT support specialists at the 10th, 25th, 75th, and 90th percentiles. California and Washington have the highest 90th percentile wages for software developers, New Jersey and the District of Columbia have the highest 90th percentile rates for IT support specialists.
U.S. NET TECH EMPLOYMENT
• U.S. net tech employment totaled an estimated 11.8 million in 2018, an increase of more than 260,000 workers over the 2017 base of 11.5 million. Net tech employment grew an estimated 2.3% year-over-year.
• Net tech employment accounted for approximately 7.6% of the overall U.S. workforce in 2018. Because of the blurring of lines across industries, there is a degree of undercounting in tech sector employment.
U.S. TECH INDUSTRY EMPLOYMENT
• U.S. tech industry employment totaled an estimated 7.3 million in 2018, an increase of 146,383 workers from 7.2 million in 2017. Tech industry employment grew an estimated 2.0% year-over-year. Tech industry employment is a subset of net tech employment.
• Tech manufacturing employment totaled an estimated 1.15 million in 2018, an increase of approximately 7,800 jobs from the previous year.
• Employment in the telecommunications and Internet services sector totaled an estimated 1.36 million in 2018, up by 20,105 jobs from 2017. These employment gains were driven by growth in the data processing, hosting, and search portal services categories, where employment increased by 33,706 jobs. Wired and wireless telecommunications services shed 13,645 jobs, a loss of 1.9%.
• The software category, consisting of published or packaged software products, rather than custom developed software, employed an estimated 397,414 workers in 2018, adding more than 20,000 net-new jobs. On a percent change basis, software led the tech sector with a 5.3% year-over-year growth rate.
• The IT services and custom software services subsector generated the largest numerical gain in employment, adding nearly 81,000 net-new jobs in 2018. This gain of 3.2% increased the employment base to 2.6 million. This growth reflects the ongoing digital transformations occurring across the economy and the corresponding need for expertise in areas such as cloud computing migration, application integration, process automation, data analytics, and security.
U.S. TECH OCCUPATION EMPLOYMENT
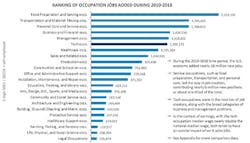
• Tech occupation jobs reached an estimated 7.89 million workers in 2018, an increase of 167,295 workers. On a percent change basis, the rate is on par with the annual growth rates experienced over the past several years, with the exception of the 2015 rate, which exceeded 3%.
• Since 2012, nearly 1.2 million new tech occupation jobs were added, a function of the demand for tech talent across every industry sector in the economy.
• The IT occupations segment of tech occupations accounts for 63% of the total. IT occupations added over 132,000 net-new jobs in 2018, a year-over-year growth rate of 2.7%. On a numeric basis, software developers, systems analysts and cybersecurity analysts, and IT support specialists recorded the largest gains in employment.
• The U.S. Bureau of Labor Statistics does not yet break out many emerging tech roles, other data sources indicate these new specialties are starting to make meaningful contributions to the growth of the tech workforce.
Like this Article?
Subscribe to ISE magazine and start receiving your FREE monthly copy today!
About CompTIA: The Computing Technology Industry Association (CompTIA) is a leading voice and advocate for the $5 trillion global information technology ecosystem; and the more than 50 million industry and tech professionals who design, implement, manage, and safeguard the technology that powers the world’s economy. Through education, training, certifications, advocacy, philanthropy, and market research, CompTIA is the hub for advancing the tech industry and its workforce. For more information about CompTIA, please visit https://www.comptia.org/.
CompTIA presents its 19th annual edition of Cyberstates. CompTIA designed this report to serve as a reference tool, making national, state, and metropolitan area-level data accessible to a wide range of users. The report quantifies the size and scope of the tech industry and the tech workforce across multiple vectors. To provide additional context, the report includes time-series trending, average wages, business establishments, job postings, gender ratios, innovation and emerging tech metrics, and more. Cyberstates 2019 (#cyberstates) is based on CompTIA’s analysis of data from the U.S. Bureau of Labor Statistics, the U.S. Bureau of Economic Analysis, EMSI, Burning Glass Technologies Labor Insights, and other sources. Estimates for 2018 are subject to change as government data is revised and updated. The full 152-pages CompTIA Cyberstates 2019™ report, and the interactive, online version with complete national, state and metropolitan level data, is available at https://www.cyberstates.org/.


